
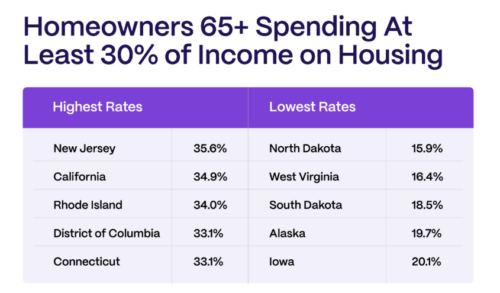
A record 12.5 million senior households are spending at least 30 percent of their income on housing, U.S. Census data shows – up from 9.3 million a decade … more High Housing Costs Disproportionately Impact Older Homeowners
Housing and Home Equity
LendingTree: Home Insurance Rate Hikes Are Outpacing Both Inflation and Income Growth

Research published by LendingTree finds that, from 2020 through 2025, home insurance rates rose 45.8 percent nationally, compared with a 26.1 percent inflation rate. That’s a 19.7 percentage … more LendingTree: Home Insurance Rate Hikes Are Outpacing Both Inflation and Income Growth
NAR: Baby Boomers Remain Largest Share of Home Buyers
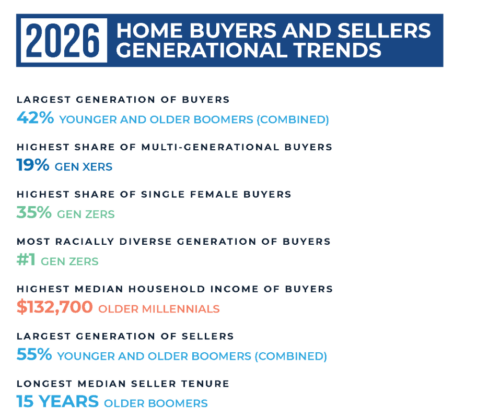
Baby Boomers remained the largest generational group of home buyers this year, while the share of first-time buyers fell to the lowest level on record, according to the … more NAR: Baby Boomers Remain Largest Share of Home Buyers
Home Prices Increase 1.3 Percent in 2025
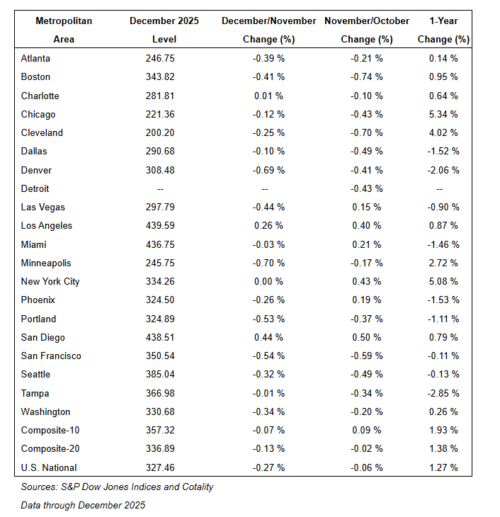
National home prices grew modestly in 2025, with a 1.3 percent annual increase, the weakest since 2011, according to the latest Case-Shiller Index. The big picture: Inflation outpaced … more Home Prices Increase 1.3 Percent in 2025
NAR: Median Age of Repeat Buyers Reaches 62

The National Association of Realtors reported in its 2025 Profile of Home Buyers and Sellers that repeat homebuyers have the highest median age, at 62. Another eight percent … more NAR: Median Age of Repeat Buyers Reaches 62
Home Prices and the U.S. Economy
You must be logged in to view this content.
Home Equity Hits Record High
The August 2025 Mortgage Monitor report published by ICE Mortgage Technology recently reported that homeowners of all ages entered Q3 with a record $17.8 trillion in total tappable … more Home Equity Hits Record High
Global Equity Release Market Forecast to Reach $56B by 2035

The European Pensions and Property Asset Release Group met recently in London to discuss issues and trends in the global equity release market. Longbridge CEO Chris Mayer (third … more Global Equity Release Market Forecast to Reach $56B by 2035
Census Bureau Tracks Property Insurance Costs By State
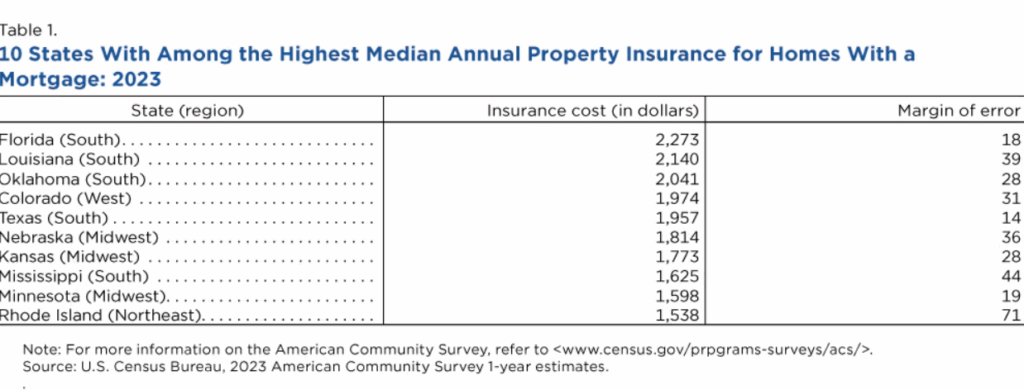
Over 5.3 million households paid more than $4,000 a year for their property insurance in 2023 but costs varied across the country, according to the U.S. Census Bureau’s … more Census Bureau Tracks Property Insurance Costs By State
Baby Boomers Regain Top Spot as Largest Share of Home Buyers

In a shift that underscores changing dynamics in the housing market, baby boomers now make up the largest generational group of home buyers, according to the National Association … more Baby Boomers Regain Top Spot as Largest Share of Home Buyers
[Page 1 of 2 ]